Solana’s native token SOL (SOL) failed to reclaim $140 on Monday despite recovering part of its recent losses. A negative funding rate in SOL perpetual futures and declining onchain activity across the Solana network continued to weigh on investor sentiment.
SOL remains down 30% over the past 30 days, underperforming the broader altcoin market. Traders are now assessing the likelihood of a sustainable bullish trend.
SOL/USD vs. altcoin market capitalization. Source: TradingView / Cointelegraph
Much of the prevailing concern among cryptocurrency investors stems from declining confidence in the United States economy, following signs of labor-market weakness and an increasing reliance on artificial intelligence investments.
The CEO of Deutsche Bank’s DWS asset manager told Reuters that there is “no playbook” for valuing the AI sector, adding that more evidence is required beyond efficiency gains to support elevated valuations.
After a record 43-day US government funding shutdown, several consumer companies reduced sales expectations following weaker-than-anticipated earnings, including Target, Home Depot and McDonald’s.
With the release of the US October Consumer Price Index (CPI) and unemployment data canceled, traders had even less visibility regarding the Federal Reserve’s monetary policy decision scheduled for Dec. 10.
Derivatives stress and fading activity continue pressuring SOL’s price
SOL’s weakness reflects a broader decline in risk appetite, but additional factors likely contributed to its underperformance relative to major altcoins. The successful launch of XRP (XRP) exchange-traded funds (ETFs) in the US increased competition for institutional flows, and launches tied to other cryptocurrencies, including Litecoin (LTC) and Chainlink (LINK), are expected to follow.
SOL perpetual futures annualized funding rate. Source: laevitas.ch
Demand for bearish leverage on SOL perpetual futures has been persistent since Friday, as the funding rate turned negative, meaning traders are paying to maintain positions that benefit from further price declines. Under neutral conditions, this indicator typically ranges between 6% and 12% to account for opportunity costs.
Aggregate SOL futures open interest has fallen 27% over the past 30 days, indicating reduced demand for leverage.
SOL 2-month futures annualized basis rate. Source: laevitas.ch
The premium on SOL monthly futures relative to spot prices has dropped to 0%, a level consistent with highly bearish market conditions. In a neutral environment, this metric generally ranges from 5% to 10%, while negative readings signal a sharp absence of demand for bullish exposure.
Bearish sentiment is likely to persist until conditions in SOL derivatives markets show a meaningful improvement.
The total value locked (TVL) on the Solana network declined to $10.5 billion on Monday, a 20% drop compared with one month earlier. Blockchain revenue, measured by weekly fees, has fallen to its lowest level since May, which helps explain why SOL has lagged behind the broader altcoin market. For comparison, Ethereum’s weekly fees are down only 5% over the same 30-day period.
Blockchains ranked by 30-day active addresses. Source: Nansen
Solana remains the clear leader in active addresses and transaction count, maintaining a wide margin over the second-place BNB Chain. More importantly, Nansen data shows a 13% increase in activity on Solana, while its main competitor, Ethereum, recorded a 15% decline. These figures may help reinforce confidence among SOL investors, but they are not, on their own, a catalyst for a sustained bull run.
SOL has gained 14% since hitting a low of $121.50 on Friday; however, this rebound does not guarantee lasting upward momentum, particularly as derivatives markets remain fragile and network fees continue to show weakness. A short squeeze toward $160 cannot be ruled out, but it would require a significantly stronger show of confidence from SOL traders.
This article is for general information purposes and is not intended to be and should not be taken as legal or investment advice. The views, thoughts, and opinions expressed here are the author’s alone and do not necessarily reflect or represent the views and opinions of Cointelegraph.
The Financial Services Agency in Japan will reportedly require cryptocurrency exchanges to maintain liability reserves as part of measures to guard against hacks or unforeseen events.
According to a Monday Nikkei report, Japan’s FSA will revise its requirements for local companies to include methods for quickly compensating users affected by security breaches or other causes. The financial watchdog reportedly cited recent hacks of global exchanges as part of the reason behind the change.
The Financial System Council, an advisory body to the FSA, is reportedly set to release a report on the matter following a meeting on Wednesday. One of the expected recommendations would require crypto firms to create liability reserve funds.
The move follows reports that the FSA plans to review regulations that would allow banks to purchase and hold crypto assets. Japan remains a country with a high concentration of crypto users, with about 12 million accounts registered as of February, according to data from the FSA. The country has a population of about 123 million.
Long after establishing regulations recognizing a potential stablecoin pegged to the Japanese yen, the Tokyo-based fintech firm JPYC launched the digital asset in October. According to the company, the JPYC stablecoin is backed one-to-one by bank deposits and government bonds.
Some of the country’s largest financial institutions, including Mitsubishi UFJ Financial Group, Bank Sumitomo Mitsui Banking Corp and Mizuho Bank, launched their stablecoin issuance platform Progmat in 2023, and are reportedly exploring their own token.
Monex Group, another Japan-based financial company, is also considering the launch of a yen-pegged stablecoin.
Bitcoin is attempting a recovery from $80,600, which several analysts believe to be a bottom.
Several altcoins are struggling to start a rebound, indicating a lack of demand from buyers.
Bitcoin (BTC) dropped roughly 8% last week, but lower levels attracted buyers. The bulls are striving to push the price above $88,000 at the start of the new week. Inflows of $238.4 million into spot BTC exchange-traded funds on Friday, according to Farside Investors’ data, indicate that the bulls are again becoming active.
Analysts at wealth manager Swissblock said in a post on X that the sharply declining risk-off signal indicates a reduction in selling pressure, suggesting that the “worst of the capitulation” may be over for now. They added that fading selling pressure and a weaker second selling wave will confirm a more reliable bottom.
Crypto market data daily view. Source: TradingView
BitMEX co-founder Arthur Hayes said in a post on X that BTC may chop below $90,000 and possibly fall into the low $80,000 levels. The ex-BitMEX chief executive expects the $80,000 level to hold.
Could BTC and the major altcoins start a sustained recovery, or will higher levels attract sellers? Let’s analyze the charts of the top 10 cryptocurrencies to find out.
S&P 500 Index price prediction
The S&P 500 Index (SPX) turned up from the 6,550 support on Friday, and the bulls are attempting to extend the recovery on Monday.
The relief rally is expected to face selling in the zone between the moving averages and the resistance line. If the price turns down from the overhead zone, the bears will again try to pull the index below 6,550. If they can pull it off, the index could plummet to the 6,350 level.
On the other hand, a break and close above the resistance line indicates that the corrective phase may be over. The index could then retest the all-time high at 6,920.
US Dollar Index price prediction
The US Dollar Index (DXY) has been facing resistance near the 100.50 level, but a positive sign is that the bulls have not ceded much ground to the bears.
The gradually upsloping moving averages and the relative strength index (RSI) in the positive territory indicate the path of least resistance is to the upside. If the price breaks above the 100.50 level, the index could surge to the 102 level. A close above the 102 resistance will complete a rounding bottom pattern, signaling a potential trend change.
Sellers will have to pull the price below the 20-day exponential moving average (99.62) to weaken the bullish momentum. The index could then drop to the 50-day simple moving average (98.81).
Bitcoin price prediction
BTC is attempting a recovery after having plunged to $80,600 on Friday, but higher levels are likely to attract sellers.
The 20-day EMA ($94,620) is likely to act as a major hurdle on the upside. If the Bitcoin price turns down sharply from the 20-day EMA, it suggests that the sentiment remains negative and the bears are selling on rallies. That heightens the risk of a drop to the $73,777 level, where the bulls are expected to step in.
Buyers will have to push and maintain the price above the 20-day EMA to gain strength. The BTC/USDT pair may then climb to the psychological level of $100,000.
Ether price prediction
Ether (ETH) is attempting to start a recovery, which may encounter significant resistance in the zone between the 20-day EMA ($3,148) and $3,350.
If the price turns down from the overhead zone, the bears will attempt to resume the downtrend. A break and close below $2,623 signals the start of the next leg of the downmove to $2,400 and then to the $2,111 level.
Instead, if buyers thrust the Ether price above $3,350, the ETH/USDT pair could reach the 50-day SMA ($3,659). A close above the 50-day SMA suggests the bulls are back in the game.
XRP price prediction
XRP (XRP) rebounded off the support line on Saturday, indicating that the bulls are trying to keep the price inside the descending channel pattern.
The bears are unlikely to give up easily and will try to halt the relief rally at the moving averages. If the price turns down sharply from the moving averages, the sellers will again attempt to pull the XRP/USDT pair to $1.61.
On the contrary, a break above the moving averages could push the price to the downtrend line. Buyers will have to pierce and sustain the XRP price above the downtrend line to suggest a potential trend change.
BNB price prediction
BNB (BNB) is attempting a recovery after hitting $790 on Friday, but the sellers are expected to enter at higher levels.
If the price turns down sharply from the $860, it suggests that the bears have flipped the level into resistance. That increases the possibility of a break below $790. The BNB/USDT pair could then plummet to $730.
The 20-day EMA ($920) remains the key overhead resistance to watch out for. A break and close above the 20-day EMA suggests that the market has rejected the break below $860. The BNB price may then rally to $1,019.
Solana price prediction
Solana (SOL) is trying to take support at the $126 level, but the shallow rebound suggests a lack of aggressive buying by the bulls.
If the price turns down from the current level or the 20-day EMA ($145), it suggests that the bears are active at higher levels. The SOL/USDT pair then risks a drop below the $126 support. If that happens, the Solana price could tumble to $110 and subsequently to $95.
Contrarily, a break and close above the 20-day EMA indicates that the bulls are attempting a comeback. The pair could then attempt a rally to the 50-day SMA ($174).
The positive divergence on the RSI suggests that the selling pressure is reducing. Buyers will have to drive the Dogecoin price above the 20-day EMA (0.16) to signal strength. The DOGE/USDT pair may then climb to the 50-day SMA ($0.18).
Alternatively, if the price turns down sharply from the 20-day EMA, the bears will again try to drag the pair below $0.14. If they succeed, the pair could collapse to the Oct. 10 low of $0.10.
Cardano price prediction
Cardano (ADA) is attempting to take support at $0.38, but the weak bounce suggests the bears are in no mood to let go.
If the price turns down from the current level and breaks below $0.38, the ADA/USDT pair could resume its downtrend. The Cardano price could descend to the Oct. 10 low of $0.27.
The $0.50 resistance is the crucial level to watch out for on the upside. If the price turns down from $0.50, it suggests that the bears remain in control. That puts the $0.38 level at risk of breaking down.
Conversely, a close above $0.50 indicates that the bears are losing their grip. The pair could then rally toward the 50-day SMA ($0.60).
Bitcoin Cash price prediction
Bitcoin Cash (BCH) turned up sharply from the $443 support on Friday and soared above the resistance line of the falling wedge pattern.
The bears are trying to pull the price back into the wedge, but the bulls have held their ground. If the price turns up and breaks above $568, it signals the start of a new up move to $615 and then $651.
This positive view will be invalidated in the near term if the Bitcoin Cash price turns down and breaks below the moving averages. Such a move suggests the break above the resistance line may have been a bull trap. The BCH/USDT pair could then retest the $443 support.
This article does not contain investment advice or recommendations. Every investment and trading move involves risk, and readers should conduct their own research when making a decision.
ZEC charts mirror BNB’s pre-crash parabola, hinting at a potential correction to the $220–$280 range next.
Analysts warn of “pump-and-dump” dynamics amid paid promotions, although some crypto veterans remain bullish long term.
Zcash (ZEC) has dropped about 30% from its November peak of $750, raising fears of deeper losses ahead, with some analysts warning of a potential “pump-and-dump.”
ZEC/USDT four-hour chart. Source: TradingView
Symmetrical triangle hints at 50% ZEC price drop
As of Monday, Zcash traded within a symmetrical triangle pattern on the four-hour chart, reflecting indecision among traders following its 1,500% price rally since late September.
The setup also followed a rebound from the 200-4H exponential moving average (200-4H EMA; the blue line), a key support trendline, suggesting a possible move toward the triangle’s upper boundary near the 0.786 Fib level at $686 in November.
Thus, a breakdown below the triangle’s lower trendline appeared to be the most likely outcome if prevailing macroeconomic conditions persist in the coming weeks.
Such a move could push ZEC toward its $282 downside target, which is approximately 50% below current levels, by early 2026.
The level aligns with the local tops established in early October, as well as the 20-period EMA (represented by the green wave) on the weekly chart.
ZEC/USDT weekly chart. Source: TradingView
BNB parabola warns of 60% Zcash price correction
Zcash’s current structure resembles the parabolic rise and breakdown previously seen in BNB (BNB) before its steep correction, according to trader Nebraskangooner.
ZEC/USDT and BNB/USDT daily chart comparison. Source: TradingView/Nebraskangooner
Much like BNB’s 2021 setup, ZEC has lost momentum after an overextended rally. Its price failed to reclaim its parabola support, as anticipated by Zcash bulls who projected a $1,000 target earlier in November.
As NebraskanGooner noted, such patterns often preceded deeper retracements of at least 60%. That brings ZEC’s potential downside target to the $220–$280 range.
Source: X
Analysts back pump-and-dump narratives
Adding to bearish sentiment, Mark Moss, a Bitcoin-focused venture capitalist and educator, shared screenshots of outreach messages from marketing agencies offering paid ZEC collaborations.
Market analyst Rajat Soni cautioned that the recent hype around ZEC may be an effort to “find exit liquidity,” citing fabricated headlines that falsely claimed Fidelity analysts predicted Zcash could hit $100,000.
Against the bearish tide, crypto bigwigs, such as BitMEX founder Arthur Hayes and Gemini co-founders Tyler and Cameron Winklevoss, remain bullish on Zcash, with the former expecting ZEC price to hit $10,000.
This article does not contain investment advice or recommendations. Every investment and trading move involves risk, and readers should conduct their own research when making a decision.
A major JavaScript supply-chain attack has compromised hundreds of software packages — including at least 10 used widely across the crypto ecosystem — according to new research from cybersecurity firm Aikido Security.
In a Monday post, Charlie Eriksen, a researcher at Aikido Security, shared the names of over 400 packages that show signs of infection with the “Shai Hulud” self-replicating malware used in an ongoing JavaScript NPM library supply chain attack. Eriksen said he validated each detection to avoid false positives.
Many of the cryptocurrency-related packages involved receive tens of thousands of downloads per week and have numerous other packages that require them to function. In an X post published earlier today, Eriksen also warned the Ethereum Name Service (ENS) team that several of their packages are affected.
Source: Charlie Eriksen
Shai Hulud is part of a broader supply chain attack trend. In Early September, the largest NPM attack reported to date saw hackers only steal $50 million of crypto. Amazon Web Services noted that this first attack was followed by the Shai-Hulud worm spreading autonomously just a week later.
While the previous attack directly targeted crypto to steal assets, Shai-Hulud is a general-purpose credential-stealing malware that spreads autonomously across developer infrastructure. If the infected environment contains wallet keys, the malware will steal them as “secrets” like any other credential.
Among all the affected packages, at least 10 were specifically related to the cryptocurrency industry, and nearly all were tied to the ENS, a human-readable address name service. Among the affected packages are ENS’s content-hash, with almost 36,000 weekly downloads, and 91 software packages depending on it, as well as address-encoder, with over 37,500 weekly downloads.
Other ENS packages affected include ensjs (over 30,000 weekly downloads), ens-validation (1,750 weekly downloads), ethereum-ens (12,650 weekly downloads), and ens-contracts (nearly 3,100 weekly downloads). A cryptocurrency-related package unrelated to ENS, called crypto-addr-codec, was also compromised, with almost 35,000 downloads.
Non-crypto-related packages affected include some offered by the corporate automation platform Zapier, including one with over 40,000 downloads per week and many not far behind. In a subsequent post, Eriksen pointed to other packages that were infected, some with nearly 70,000 weekly downloads, and to another package seeing well over 1.5 million weekly downloads.
“The scope of this new Shai Hulud attack is frankly massive; we’re still working through the queue to confirm it all,” Eriksen wrote on X.
“It’ll make the previous attack look like nothing.“
Researchers at cybersecurity firm Wiz claim to have “spotted over 25,000 affected repositories across ~350 unique users, 1,000 new repositories are being added consistently every 30 minutes in the last couple of hours.” The company recommends “immediate investigation and remediation” for any environment using npm.
Ethereum co-founder Vitalik Buterin has said a new feature rolled out by X revealing an account holder’s country was “risky,” agreeing with crypto users who flagged privacy concerns over the feature.
X director of product Nikita Bier announced the feature was rolled out on Saturday, framing it as a way to ensure the integrity of the platform and allow users to verify information.
Buterin said on Sunday that some accounts will eventually “find ways to pretend to be from countries that they are not,” but initially thought the change could have positive effects, such as increased visibility into how people from different communities feel about various issues.
“I thought about this more and I think responders are right that revealing the country non- ‘consensually without offering any opt-out option, not even stop using your account, is wrong,” Buterin later said.
“In most cases, revealing country still leaves a very large anonymity set, but there are some people for whom even a few bits of leakage are risky, and they should not have their privacy retroactively rugpulled with no recourse.”
“The problem isn’t showing country; it’s forcing everyone into visibility without notice. A privacy-sensitive feature should always start with the least revealing setting,” he said.
Crypto users share how to opt out
Bier said that there was a privacy toggle to only show an account’s region, “for those in countries where speech has penalties.”
The X user “Langerius,” a lead at Web3 community and consulting group Hunters of Web3, said there is a way for concerned users to opt out of the new feature.
“If you want to hide it: 1- turn it off: settings & privacy → privacy & safety → disable country visibility 2- or switch from country to region/continent in same menu,” they explained.
Other X users were more positive about the new feature. Some argued that revealing an account location in a country the size of the US, with a population of around 350 million, was unlikely to leave anyone easily identifiable.
More still, including crypto venture capitalist Nic Carter, said the feature was necessary to prevent accounts linked to overseas users from attempting to interfere in politics by masquerading as being from a particular country.
Crypto tokens are becoming increasingly efficient at capturing value, thanks in part to new regulations and upgrades, which could send prices surging in 2026, according to Bitwise chief investment officer Matt Hougan.
Hougan said in an X post on Saturday that in the chaos of the current market pullback, big news is getting lost, such as the level of value capture in digital assets trending upward.
“Most of today’s tokens were created in a regulatory era where value capture was risky; as a result, they defaulted to vague governance-style design choices,” he said.
“Under the new regulatory climate, that’s being unwound. I think we’ll start to feel this effect in 2026.”
Uniswap (UNI), the native token behind the crypto protocol of the same name, surged earlier this month after the Uniswap Foundation and Uniswap Labs introduced a proposal to make the token more attractive as an investment.
Among the ideas being floated were a protocol-level fee mechanism to burn the tokens and building a Protocol Fee Discount Auctions system to increase liquidity provider returns.
Hougan said this is one of the most obvious examples of a token trying to capture value, and predicts that if the proposal passes, it could send UNI into the top ten by market cap in the future.
“The big knock on UNI has always been that it is a governance token. Uniswap is great, but activity on Uniswap didn’t benefit UNI tokenholders,” he said.
“Except now, UNI is considering flipping the fee switch. If the vote goes through, ~16% of trading fees will be used to burn UNI. I suspect this will push UNI toward being a top 10 token by market cap over time.”
Fusaka upgrade could see Ether lead rebound
Hougan also pointed to Ethereum’s Fusako upgrade as a catalyst that could “significantly increase token value capture.”
The Fusako upgrade mainnet launch is expected in December and will roll out upgrades to Ethereum’s execution layer and improvements to staking economics, among other upgrades.
“I suspect the market will start to orient around the positive impacts of Fusaka soon, particularly if it’s delivered Dec. 3 as expected. It’s an under-appreciated catalyst and one reason ETH could lead the crypto rebound,” Hougan said.
Hougan said Ripples XRP (XRP) token is also on the road to increasing its value capture with a possible staking addition.
“You see a growing focus on value capture in XRP as well. The community is starting to consider ideas like staking, which would change the economics for tokenholders,” he said.
“The connecting thread: The level of value capture in digital assets is up only from here. I think people look at token value capture as static. It’s not.”
The key drivers of Bitcoin’s rally to a peak in October are now what’s causing its price to drop to multimonth lows, with crypto treasury reversals and crypto fund outflows suggesting “actual capital flight” rather than purely negative sentiment, says NYDIG.
NYDIG head of research Greg Cipolaro said in a note on Friday that exchange-traded fund (ETF) inflows and digital asset treasury (DAT) demand were key to Bitcoin’s (BTC) last cycle.
“Historically, once that loop breaks, the market tends to follow a predictable sequence. Liquidity tightens, leverage attempts to re-form but struggles to gain traction, and previously supportive narratives stop translating into actual flows.”
“We’ve seen this in every major cycle. The story changes, but the mechanics don’t. The reflexive loop pushes the market up, and its reversal sets the stage for the next phase of the cycle,” Cipolaro added.
ETF capital flowing out, but Bitcoin dominance growing
Spot Bitcoin ETFs, which Cipolaro said have been the standout success story of this cycle, have flipped from a reliable inflow engine “into a meaningful headwind,” but a wider set of factors, such as global liquidity shifts, macro headlines, market structure stress, and behavioral dynamics, are still influencing Bitcoin.
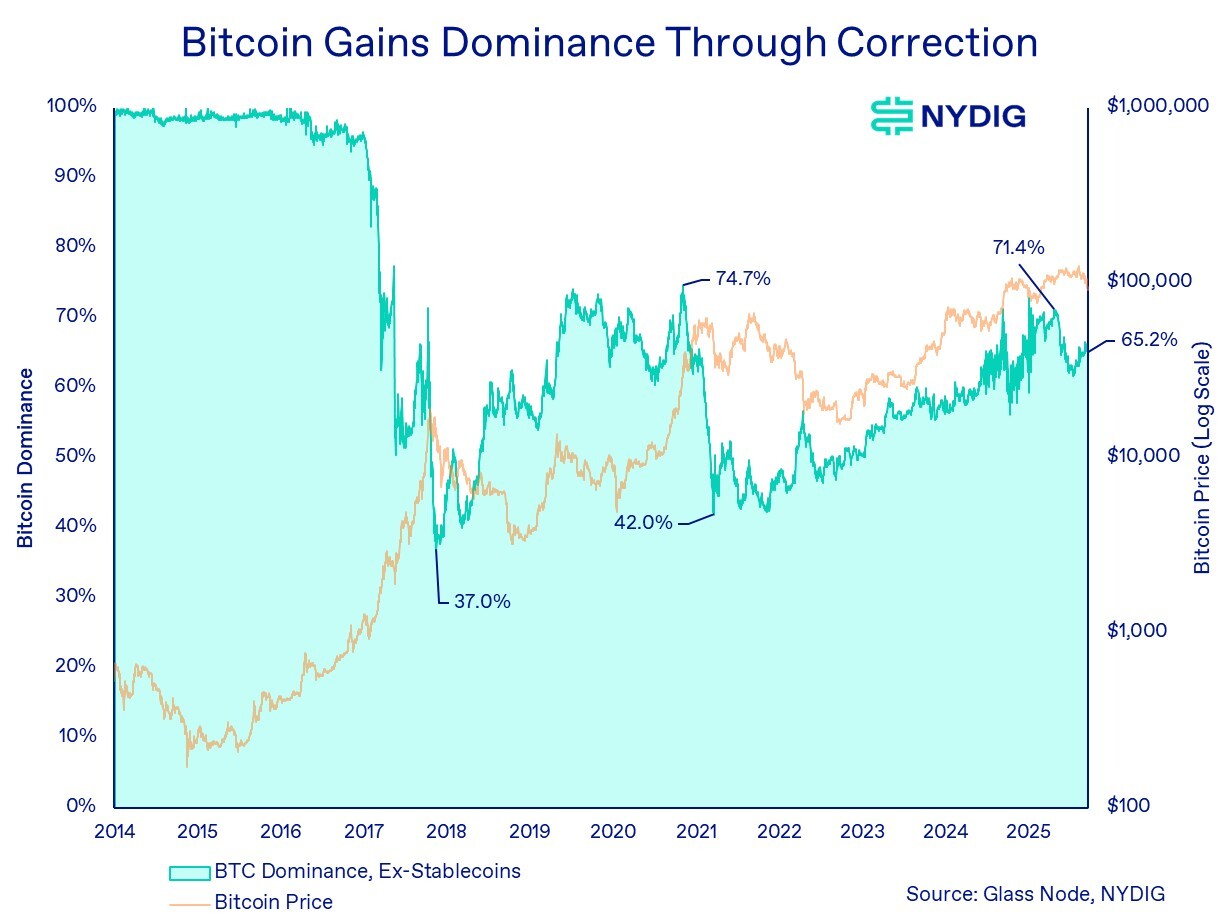
“Bitcoin dominance tends to surge during cyclical drawdowns, as speculative assets unwind more aggressively and capital consolidates back into the most established, most liquid asset in the ecosystem. We’ve seen this dynamic repeatedly and we’re seeing it again,” he said.
Bitcoin dominance tends to surge during drawdowns as capital consolidates back into the most established, most liquid asset. Source: NYDIG
Bitcoin dominance crept back over 60% in early November and has since settled to around 58% as of Monday, according to crypto data platform CoinMarketCap.
DATs and stablecoins dip
DATs and stablecoins were also a significant source of structural demand for Bitcoin. However, Cipolaro said DAT premiums, where shares traded relative to net asset value (NAV), have compressed across the board, and stablecoin supply has dipped for the first time in months, with investors appearing to be withdrawing liquidity from the ecosystem.
Even if the market drawdown deepens, Cipolaro said the DAT sector still has a long runway before actual stress becomes a concern.
“Importantly, while these reversals mark a clear shift from a once-strong demand engine to a potential headwind, no DAT has yet shown signs of financial distress.”
“Leverage remains modest, interest obligations are manageable, and many DAT structures allow issuers to suspend dividend or coupon payments if needed,” he added.
Despite the recent pullback, Cipolaro believes the “secular story for Bitcoin remains intact,” as it continues to gain institutional traction, sovereign interest is slowly building, and its role as a neutral, programmable monetary asset remains very much in play.
“Nothing in the past few weeks changes that long-horizon trajectory. But the cycle story, the one driven by flows, leverage, and reflexive behavior, is now asserting itself far more forcefully,” he said.
“Investors should hope for the best, but prepare for the worst. If past cycles are any guide, the path forward is likely to be uneven, emotionally taxing, and punctuated by sudden dislocations.”
Bitcoin’s (BTC) price volatility has surged over the last two months, signaling a potential return to options-driven price action that sparks large market moves in both directions.
Bitcoin’s implied volatility never broke past 80% after Bitcoin ETFs were approved in the United States, according to Jeff Park, a market analyst and advisor at investment firm Bitwise.
However, a chart shared by Park shows that Bitcoin’s volatility is creeping back up to about 60 at the time of this writing.
Historical BTC volatility levels show large spikes before Bitcoin exchange-traded funds were approved for US markets in 2024. Source: Jeff Park
Park cited Bitcoin’s explosive price action in January 2021, which kicked off the 2021 bull run that took BTC to new all-time highs and a cycle top of $69,000 in November of that year, as the last major options-driven melt-up. He said:
“Ultimately, it is options positioning, not just spot flows, that creates the decisive moves that carry Bitcoin to new highs. It’s possible that for the first time in nearly two years, the volatility surface is flickering with early signs that Bitcoin might become option-driven again.”
The analysis counters the theory that the presence of ETFs and institutional investors has permanently smoothed out Bitcoin’s price volatility and shifted market structure to reflect a more mature asset class, bolstered by passive inflows from investment vehicles.
Analysts have presented several theories about the causes of the downturn, including the liquidation of highly leveraged positions in derivatives markets, BTC long-term holders cashing out, and macroeconomic pressures.
The ongoing BTC downturn is due to short-term factors and signals “tactical rebalancing,” rather than institutional flight or a lack of demand, according to analysts at crypto exchange Bitfinex.
This does not derail Bitcoin’s long-term fundamentals, price appreciation, or institutional adoption trends, the analysts said.
Bitcoin has taken a slide back to its April level of around $83,000, with mounting selling pressure prompting many investors to sell at a loss, reminiscent of major historic market crashes.
Realized losses on Bitcoin (BTC) have surged to levels not seen since the 2022 FTX collapse, according to blockchain data platform Glassnode.
“The scale and speed of these losses reflect a meaningful washout of marginal demand as recent buyers unwind into the drawdown,” Glassnode noted in an X post on Friday.
Glassnode’s observation came minutes before Bitcoin slipped as low as $80,500 on Coinbase, marking a 36% decline from its all-time high of $126,210 recorded just weeks ago in early October.
Short-term holders driving the capitulation
According to Glassnode, a big chunk of selling in the ongoing Bitcoin crash is due to short-term holders.
Data from analytics platform CryptoQuant shares a similar perspective, noting that short-term selling “often marks a local bottom if the price quickly reclaims the cost basis.”
“Failing to do so historically indicates a deeper bearish trend or confirms a bear market,” CryptoQuant wrote on X on Thursday.
Although many market observers say the current downturn could signal the end of the bull market that began in 2023, prominent industry figures such as Jan3’s Samson Mow have cast doubt on the onset of a crypto winter.
“How can we have a bear market when we haven’t even had a proper bull market?” Mow asked in a post on X on Thursday, referring to growing caution across the market.
Where is the bottom?
With Bitcoin in the red for four straight weeks and the Crypto Fear & Greed Index plunging into “Extreme Fear,” the question of how low BTC could fall has become a major concern.
“We’ve been slicing through support levels like butter lately, and nobody seems to want to try and catch the knife,” Quantum Economics CEO Mati Greenspan told Cointelegraph, adding:
“While I utterly reject the notion that we’re heading into a multi-year bear market, with the speed of the current meltdown, the bears may hit their targets much sooner than expected.”
The collapse of FTX in November 2022 came on the heels of the Terra Luna crash six months earlier, as Bitcoin dropped from around $33,000 in May to below $16,000 by November. Some observers linked the two events, speculating that FTX’s liquidity crisis may have begun earlier than publicly disclosed.
Bitcoin price chart from January 2022 to October 2023. Source: CoinGecko
After bottoming out at around $15,700, the BTC price had remained below $20,000 for two months before starting its path to the bull market that began in 2023, according to CoinGecko data.
According to some major industry bulls, a market bottom could arrive within a similar time frame this time.
Tom Lee, co-founder of Fundstrat Global Advisors and head of Ether (ETH) treasury strategy at BitMine, has predicted that Bitcoin could rebound to between $150,000 and $200,000 by the end of January 2026.


